You’ve been told to “monitor your blood pressure at home.” Great. But what does that actually look like in practice? Scribbling numbers on the back of an envelope? Typing them into your phone notes? Forgetting half of them by the time your GP appointment arrives?
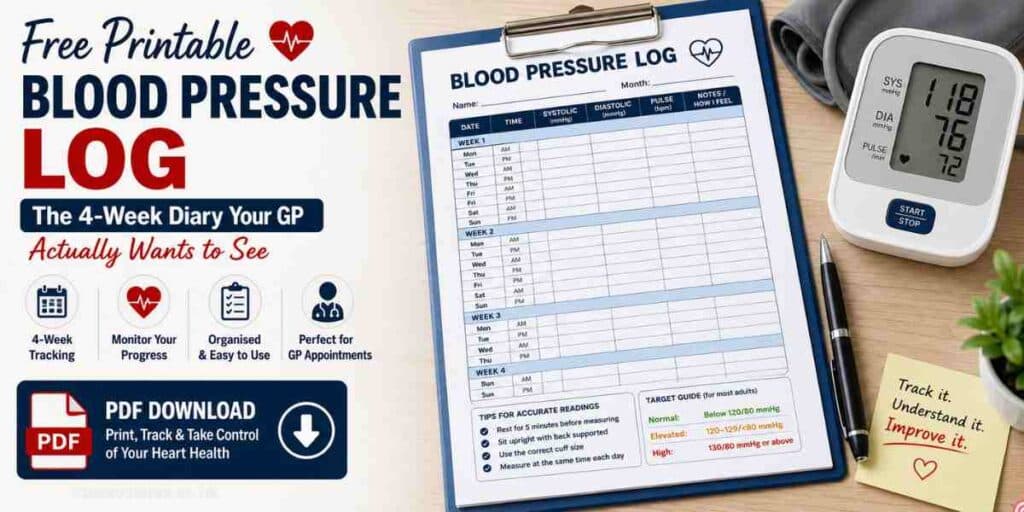
A proper blood pressure log changes everything. It turns scattered readings into a clear, organised record that your GP can interpret in seconds — revealing patterns, trends, and potential problems that no single reading could ever show. And the good news? You don’t need to buy one. We’ve created a free, printable blood pressure diary designed around the exact monitoring protocol recommended by NICE guideline NG136 — the same standard your GP uses.
📄 Download Your Free Blood Pressure Log (PDF)
4-week diary with morning & evening tracking, weekly averages, monthly summary, GP notes section, and NHS reference chart. Print as many copies as you need — completely free.
📋 What’s Inside the Log
- Page 1: Instructions + NHS blood pressure categories chart + personal details section
- Pages 2–5: Four weekly log sheets — morning & evening columns, space for systolic, diastolic, pulse, and notes
- Page 6: Monthly summary table + GP appointment notes section
📖 In This Guide
1. Why Keeping a Blood Pressure Log Matters (More Than You Think)
A single blood pressure reading is a snapshot — and snapshots lie. Your blood pressure fluctuates minute to minute based on stress, activity, caffeine, sleep, hydration, and even the time of day. A reading of 148/92 at the GP surgery might drop to 124/78 an hour later at home. Without a log, you’d never know which one represents your true blood pressure.
A blood pressure log solves this by revealing:
- Your true average — smoothing out daily fluctuations to show the number that actually predicts your health risk
- Time-of-day patterns — some people have elevated morning readings (“morning surge”) that carry higher stroke risk
- Medication effectiveness — is your tablet actually working? The log shows trough readings (before your next dose) that reveal whether coverage is adequate
- White coat vs real hypertension — if your GP readings are high but home readings are normal, the log proves it
- Lifestyle triggers — notes column reveals that your readings spike every Monday morning (work stress?) or drop after evening walks
When a patient walks in with a neatly completed 4-week blood pressure log, it gives the GP more useful clinical information than a dozen individual clinic readings. It’s the difference between guessing and knowing — and it directly influences medication decisions.
2. How to Fill In Your Blood Pressure Log (Step-by-Step)
Morning Session (Before Breakfast & Medication)
- Empty your bladder
- Sit quietly for 5 minutes with back supported, feet flat, legs uncrossed
- Take your first reading — record it but know the second reading is typically more accurate
- Wait 1–2 minutes, take a second reading
- Record the second reading in the Morning columns (systolic, diastolic, pulse)
- Add any notes (“slept badly”, “felt anxious”, “rushed morning”)
Evening Session (Before Dinner)
- Wait at least 30 minutes after any exercise or stressful activity
- Repeat the exact same sitting protocol
- Take two readings, 1–2 minutes apart
- Record the second reading in the Evening columns
- Add any relevant notes
“Stressful day at work”, “walked 30 min before dinner”, “drank wine last night”, “poor sleep” — these short notes help your GP connect your readings to real-world triggers. Patterns often emerge that would be invisible without them.
Related: How to Measure Blood Pressure at Home — 6-Step Guide
The exact clinical technique to ensure every reading in your log is accurate.
3. The NICE 4–7 Day Monitoring Protocol (What Your Log Is Designed For)
Our log follows the exact monitoring protocol recommended by NICE guideline NG136 for confirming a hypertension diagnosis:
Our printable log provides 4 full weeks of tracking — far more than the minimum NICE requires. This gives you and your GP a comprehensive picture and allows you to spot week-over-week trends.
4. How to Calculate Your Weekly Average
At the end of each week, calculate your average using the readings from Day 2 onward:
- Add up all your systolic (top) numbers from Day 2 onward
- Divide by the number of readings
- Repeat for diastolic (bottom) numbers
- Write your weekly average in the shaded row at the bottom of each week
Or skip the maths entirely — enter your readings into our free online calculator and get your exact average instantly:
📈 Calculate Your Average Instantly
Type in your readings from the log and get your true blood pressure average in seconds — no maths required.
Related: How to Work Out Your Average Blood Pressure
Full walkthrough with worked examples showing exactly how to calculate your average.
5. 5 Patterns in Your Log That Should Prompt Action
Once you have a few weeks of data, look for these patterns:
Pattern #1: Morning readings consistently higher than evening.
This is called “morning surge” and is linked to higher stroke risk. It may mean your medication is wearing off overnight. Tell your GP — they may adjust the timing of your dose.
Pattern #2: Week-over-week average is climbing.
If your average is 128/82 in Week 1 but 136/88 by Week 3, something is changing — stress, diet, medication compliance, or a worsening underlying condition. Book a GP review.
Pattern #3: Large swings between readings (more than 20 mmHg difference).
This variability — called “labile blood pressure” — is itself a cardiovascular risk factor. Bring the log to your GP to discuss.
Pattern #4: Home average is normal but GP reading was high.
This is classic white coat hypertension. Your log is the evidence that proves it — share it with your GP before they prescribe unnecessary medication.
Pattern #5: Readings after specific activities are consistently elevated.
If your notes column shows spikes every time you drink coffee, skip sleep, or have a stressful workday, you’ve found your personal triggers — and your most effective intervention points.
6. How to Present Your Log to Your GP (Maximum Impact in a Short Appointment)
GP appointments are typically 10 minutes. Don’t waste time reading individual numbers aloud. Instead:
- Complete the Monthly Summary page before your appointment — this gives your GP the averages at a glance
- Highlight any concerning patterns — circle readings that were unusually high or any symptoms you noted
- Bring the whole log — your GP may want to flip through the detail
- Ask specific questions: “My morning average is 142/88 but evening is 126/78 — should we adjust my medication timing?”
- Use the GP Notes section on the last page to record what your doctor says — dosage changes, next review date, tests ordered
📄 Ready to Start Tracking?
Download your free 4-week blood pressure log, print it out, and start taking control of your numbers today.
7. Frequently Asked Questions
How long should I keep a blood pressure log?
For confirming a new diagnosis, NICE recommends at least 4–7 days of monitoring. For ongoing management, keeping a continuous log — even if you only measure a few times per week — gives your GP the best long-term picture. Our printable covers 4 full weeks per copy; simply print a new one each month.
Should I record every reading or just the second one?
The NICE protocol recommends taking two readings each session and using the second reading as your primary number, since the first tends to be slightly elevated due to cuff placement and initial anxiety. Our log is designed for the second reading, but you can note the first in the notes column if you wish.
Why do I discard the first day’s readings?
The first day of home monitoring tends to produce higher readings because of novelty anxiety — you’re unfamiliar with the process, worried about what the numbers will show, and hyper-aware of the cuff. By Day 2, most people have settled into a routine and their readings are more representative of their true blood pressure.
What is a normal blood pressure reading at home?
A normal home blood pressure average is below 135/85 mmHg. Note that this is lower than the clinic threshold of 140/90 mmHg, because home readings are typically lower due to the absence of white coat anxiety. If your home average is at or above 135/85, your GP will likely classify this as hypertension.
Can I use a digital app instead of a paper log?
Absolutely. Many blood pressure monitors come with companion apps that store readings automatically. However, a paper log has distinct advantages: it’s always accessible (no battery or app needed), it’s easy to hand directly to your GP, and the act of physically writing down readings encourages consistency. Many patients use both — the app for convenience and the paper log for GP appointments.
Is this log suitable for use during pregnancy?
Yes. Home blood pressure monitoring is particularly important during pregnancy, where changes can signal pre-eclampsia. Record your readings the same way, and report any reading of 140/90 or above — or any sudden increase — to your midwife or GP immediately.
How many copies should I print?
Each copy covers 4 weeks. Print one per month for ongoing monitoring. If your GP has asked for a diagnostic course of monitoring, one copy is usually sufficient. The PDF is yours to keep — print as many as you need, completely free.